

|
Getting your Trinity Audio player ready...
|
Founded in 1903 and headquartered in Hong Kong, the South China Morning Post is one of Asia’s most respected news organizations. It is also one of the most progressive with a strong emphasis on audience engagement across multi-channels – SCMP’s UGC YouTube channel reached a staggering 1 billion views in 2020 alone, whilst this year the publisher has ventured into the Metaverse as part of The Sandbox’s Alpha Season 2.
However, it is the publisher’s use of infographics that has recently made its own headlines, with SCMP’s graphics team winning more than 70 awards in 2021, including 23 wins at the Society for New Design – Best of Digital Design Awards. SCMP also garnered 2 golds at the 29th Malofiej International Infographics Awards. Medal-winning infographics include “How Coronavirus Spread in Hong Kong” and “Apocalypse Now.”
The awards, however, are a side story – it is the power of infographics as an audience engagement tool that has seen the publisher double down on the medium, not least because SCMP’s infographics content is 12 times, or 1,155% more likely to become evergreen compared to its other articles. WNIP caught up with Marcelo Duhalde, Associate Creative Director and Jin Klenk, Associate Director, Audience Growth, to find out more.
WNIP: What makes a successful infographic? How do you balance representing detailed, nuanced data with creating an easy-to-read graphic?
Marcelo Duhalde: What makes a successful infographic is the originality of the topic and the creativity with which the visual elements are employed – not necessarily the interactivity. Audiences prefer illustrations and don’t feel engaged by standard graphics that they see on most news websites. Investing more in informative illustrations has produced good results for us.
Producing infographics in this department cannot be the work of a single designer because there is an overwhelming amount of detail to keep an eye on, and a lot of information to visually elaborate using a variety of skills.
We always use original resources in the infographics, we never use image banks or third-party agencies, and we will never repeat resources in our work – each piece is totally original.
Our goal is not to overwhelm the reader with too many visual stimuli.
Marcelo Duhalde, Associate Creative Director, SCMP
Infographics score big with evergreen content
WNIP: What evidence do you have that visual content drives long-term readership?
Jin Klenk: We wanted to understand which types of article content sustain more stable, long-tail readership, so we built a scoring system that ranked the performance of evergreen content.
Being in the top 5% of articles in terms of traffic within a predefined time period earns evergreen status. From the evergreen data score, we see that infographics content is 12 times, or 1,155% more likely to become evergreen compared to other articles.
Among those articles that have earned evergreen status, infographics content’s lifetime pageviews are 78% higher than the average article we publish. Therefore, we believe we have proven the value of infographics content in the way it contributes to stable, long-term SCMP readership.
Jin Klenk, Associate Director, Audience Growth, South China Morning Post
WNIP: Why do you think infographics are more likely to be evergreen content?
Jin Klenk & Marcelo Duhalde: Infographics content is easier to digest and understand for a wide audience. With so much news available, people are increasingly looking for bite-sized content that takes less time to digest, and infographics serve exactly this purpose.
There are many infographic pieces that we have created previously that may have fallen out of the current news cycle interest, but still retain value as a visual reference for those interested in that specific subject matter and for a more general audience.
Infographics and the intersection with news
WNIP: What are SCMP’s strategies in employing infographics as part of its news offering?
Marcelo Duhalde: Infographics and multimedia teams must be present in any newsroom that is considered relevant. They are no longer a group of designers adapting news reports to visually appealing formats – they are now self-contained teams that produce original content.
For us, infographics showcase the diversity of SCMP’s news offering and exemplify the approach to inform, educate and explain the news.
Behind every infographic is a guarantee of detailed research. There are several channels to reach audiences, and readers appreciate that the content is accessible in various formats.
Marcelo Duhalde, Associate Creative Director, SCMP
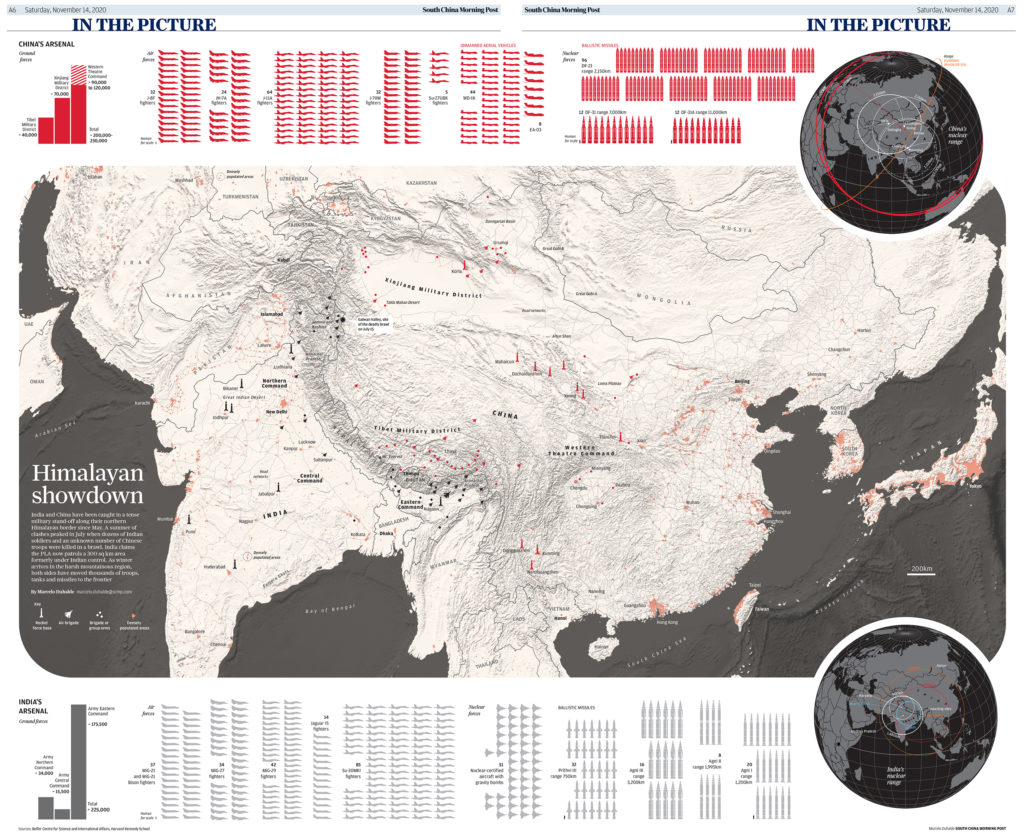
Jin Klenk: The evergreen infographics that have attracted the highest readership so far include the masterpiece that is our Coronavirus visual explainer, the India-China border clash and Why China has the world’s most heavily monitored cities. These pieces have been classed as evergreen for more than 9 months up until May 2022.
WNIP: What is your role to try to move the needle to get some of these infographics more visible to readers? What are the strategies in terms of audience growth?
Jin Klenk: We determine the angle and design the format by taking into account which readers the content will resonate most with. Cross-team efforts such as optimizing the headline, description, and multimedia elements also set up the content for success and attract substantial exposure from search engines and social networks.
The Audience Growth team routinely provides data-informed insights and recommendations to editorial desks across the newsroom. For example, we consult with the graphics team to lead the piece in the direction that we believe will be the most appealing to the target audience.
WNIP: How can you reduce the friction points when the user interacts with your visuals?
Marcelo: At the moment, we carry out simultaneous intensive usability tests on several screens to detect possible friction points. We also share our pieces within the newsroom and observe how our colleagues interact with the graphics – this short exercise is immensely helpful in improving our products.
We are interested in implementing more audience surveys and user testing programs moving forward.
WNIP: Thank you both.