

|
Getting your Trinity Audio player ready...
|
This is the second in our new monthly series offering the most important data and research about the media and communications industries.
Here’s 10 key numbers from the past month which caught our eye:
1. U.S. adults spend over 11 hours a day connected to media
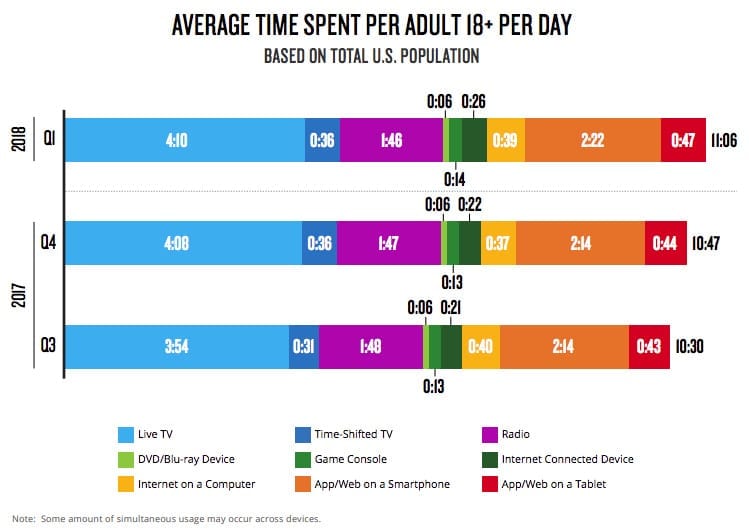
The Nielsen Total Audience Report for Q1 2018 provided a detailed insight into US media habits across digital as well as linear (television and radio) platforms.
A key takeaway, and a media behaviour which is often overlooked, is the continued popularity of Live TV. On average, US adults watch more than four hours a day of live TV, considerably more time than they spend with any other medium.
US adults watch “almost six hours a day with video alone” once time spent with a TV set, computer video, and using video focused app/web on smartphones/ tablets, are added into the mix.
Of these 5 hours 57 mins, 4 hours 46 mins are spent watching Live and Time-Shifted TV.
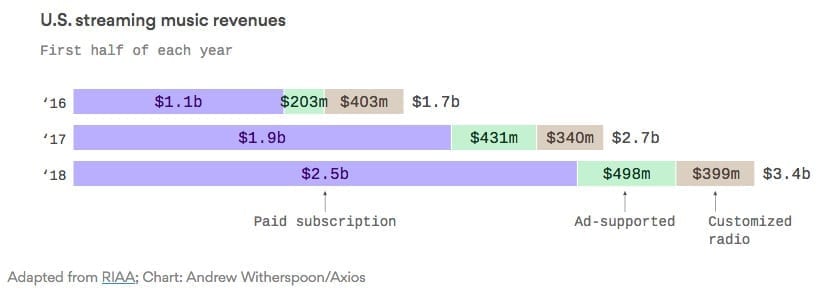
2. 75% of all U.S. music streaming revenue now comes from subscriptions
This month saw streaming revenues reach “an all-time high as more people pay for services like Spotify and Apple Music,” wrote Sara Fischer in an Axios Media Trends newsletter.
For publishers and other media creators, this comes off the back of growing subscriber numbers for services like Netflix and Amazon Prime, suggesting that – if the price point and content proposition is compelling enough – audiences will pay for content.
That’s potentially good news, as publishers increasingly pivot to paywalls. Although, as we will see later, it’s not quite as simple as that.
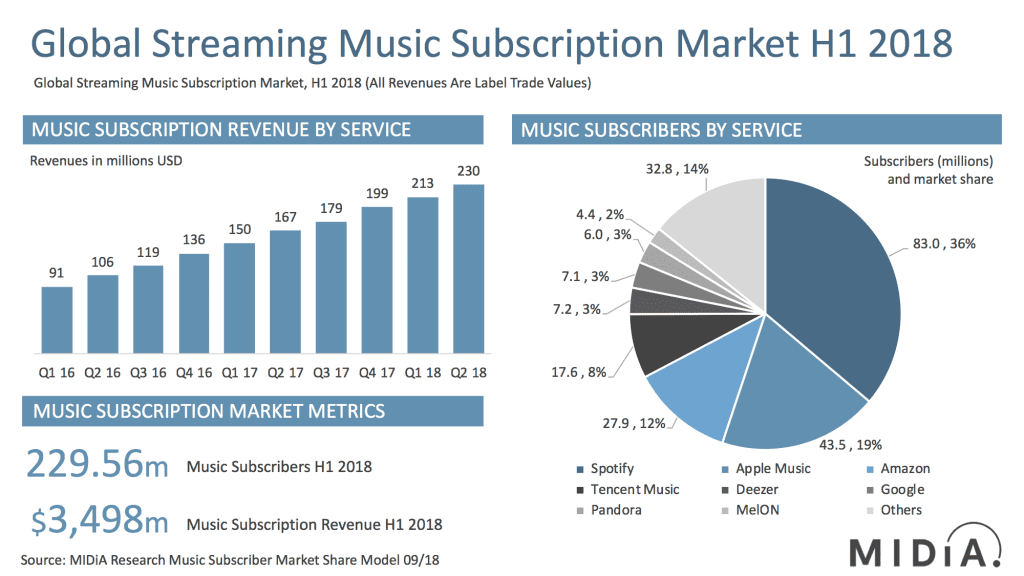
3. Globally 229.5M pay subscriptions for music streaming services
Data from MIDiA Research reveals that “year-on-year the global subscriber base increased by 38%, adding 62.8 million subscribers.” Music subscriber numbers have more than doubled – from 106 million – in the past two years.
Spotify leads the way, with 36% market share, followed by Apple Music (19%), Amazon (12%) and Tencent (8%). Pandora, which was acquired by the satellite radio company Siruis XM last month for $3.5 billion, enjoys 3% share worldwide.
“Subscriber growth remains on the faster-growth midpoint of the S-curve,” observed MIDiA founder Mark Mulligan, expressing a view that “growth phase will last through the remainder of 2018 and likely until mid-2019.”
“This will be the stage at which the early-follower segments will be tapped out in developed markets. Thereafter, growth will be driven by mid-tier streaming markets such as Japan, Germany, Brazil, Mexico, and Russia. These markets have the potential to drive strong subscriber growth, but, in the case of the latter three, will require aggressive pursuit of mid- tier products – including cut-price prepay telco bundles, as seen in Brazil.”
4. But, in the US alone, 157 million people still stream music for free
Despite positive data about the rise of paying music streaming subscribers – more 50 million Americans now do this, nearly double the number at the end of 2016 – Billboard offered a more sobering analysis.
“There’s a twist,” Cherie Hu observed, “an estimated 20 million separate users in the U.S. are currently sharing one of these paid accounts without shelling out money themselves… In addition, at least 29 million users are either on free trials of streaming services without having yet converted to paid tiers, or are automatically subscribed to bundled music services without necessarily being active users (e.g. Amazon Prime Music).”
“In total,” she concluded, “157 million people in the country still stream music for free without trials, on platforms like YouTube or Spotify’s free tier.”
As more publishers embrace paywalls, issues around sharing account passwords (also a problem for Netflix and others) are only likely to increase. As a result, it’s essential that publishers seek to learn from the mistakes – and successes – of other media industries, as they navigate these choppy digital waters.
5. 45% of smart speaker owners are planning to buy another one
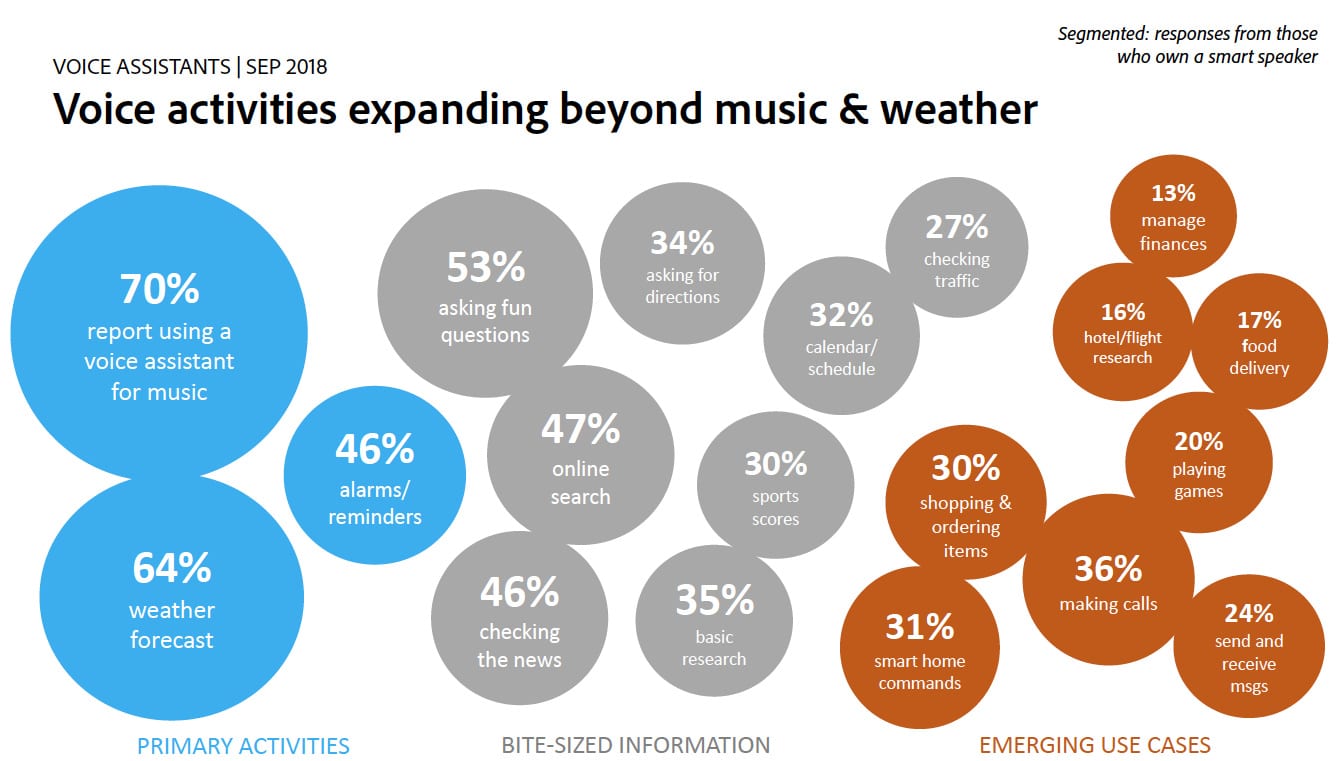
Smart speakers – like Amazon Alexa, Google Home, or Apple HomePod – are hot right now, and with good reason, according to a survey of 1,000+ US consumers conducted by Adobe.
Their research found that nearly half (48%) of US consumers are likely to own a smart speaker by the end of the year, with 32% of existing owners, and a further 16% of non-owners, intending to get one during the upcoming holidays.
Among existing owners, 71% report using the tool on a daily basis, 44% multiple times, and only 16% said they used it monthly (8%) or almost never (8%). The most popular uses – as shown in the chart below – tend to be functional or music-led (new insights from Nielsen reinforce this), but the popularity of search, news and sports scores are nonetheless worth noting.
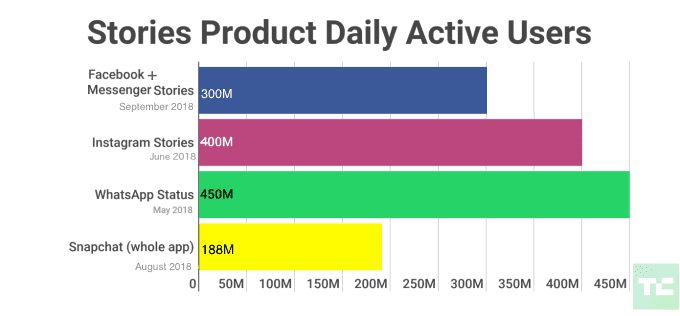
6. Facebook Stories reach 300M users a day as Story Ads go global
This combined figure for Facebook and Facebook Messenger, was highlighted by Josh Constine in Techcrunch, as part of a wider feature on Facebook’s process for product development.
Constine has previously written about the rapid growth of stories, noting that: “Nearly a billion accounts across Snapchat, Instagram, WhatsApp, Facebook, and Messenger now create and watch these vertical, ephemeral slideshows.”
Meanwhile, Buffer’s Managing Editor, Ash Read, has suggested “we may see Stories begin to rival the news feed as the default content consumption and creation method in the not-to-distant future.” It’s a view shared at Facebook’s F8 conference earlier this year, when Chris Cox, Facebook’s chief product officer, said “the Stories format is on a path to surpass feeds as the primary way people share things with their friends sometime next year.”
Given this, it’s no surprise that in late-September Facebook Stories ads were opened up to advertisers all around the world. “Advertising in stories has proven to drive valuable business outcomes,” they wrote in a blog post announcing the move.
“In the Ipsos survey [a 12 nation internal study of users aged 13-54 who consume stories at least once a week on a Facebook owned property], 62% of people said they became more interested in a brand or product after seeing it in a story. And brands testing Facebook Stories ads are already seeing results. iHeartRadio, Kettle Chips and KFC are among the advertisers who have seen brand lift from their Facebook Stories ad campaigns.”
The move serves as a reminder that if publishers are not already thinking about the stories format, then they need to start doing so.
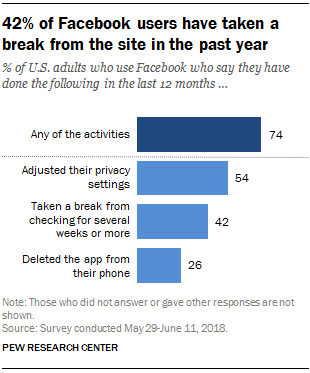
7. 44% of 18-29 year olds say they deleted Facebook’s app last year
The decision to go all-in on Stories comes at a time when “Americans are changing their relationship with Facebook.”
A Pew Research Center found that just over half of Facebook users aged 18 and older (54%) claim to have changed their privacy settings in the past 12 months and “around four-in-ten (42%) say they have taken a break from checking the platform for a period of several weeks or more.”
Across all age groups sampled, 26% said they had deleted the app from their phone. Among younger users, that figure stood at 44%.
8. This year marketers from all over the world will spend $20.6 B on data
The 2nd edition of OnAudience.com’s “Global Data Market Size” report found that the largest markets for data are the US (which will spend $12.3 B on data this year, almost 60% of global data market value).
This is followed by the UK ($1.8 B), China ($1.46 B), Canada ($588.7 M) and France ($340.7 M). China is the fastest growing data market up +95.5% YoY.
Much of this spend is aimed at harnessing 3rd party digital data which provides insights on customers’ behaviour, interests and purchase intentions.

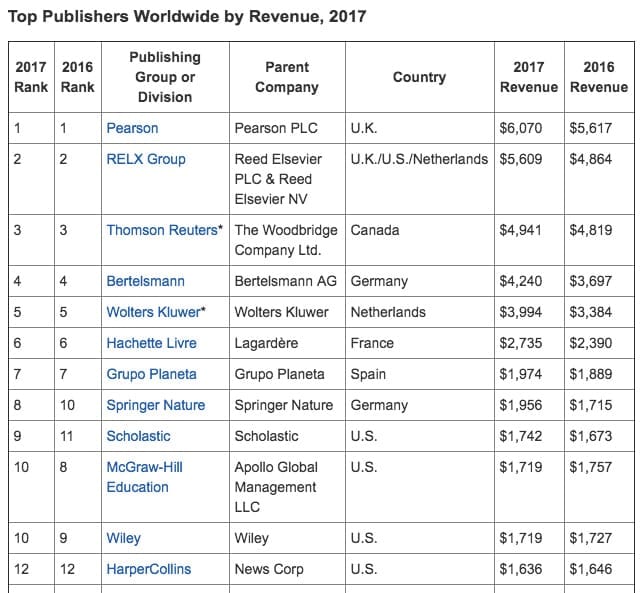
9. The world’s top publisher posted sales of over $6 billion last year
Pearson, the U.K.-based educational publisher, led the latest rankings from Livres Hebdo / Publishers Weekly, which were announced last month.
“Overall, the top 10 largest companies performed well in 2017, with every company posting higher revenue in 2017 than in 2016,” noted Jim Milliot in Publishers Weekly.
“Financial results for the 53 companies included in the 2017 ranking were stronger overall than in 2016, when less than half of the listed publishers had increases over 2015,” he added, observing how: “In 2017, only nine publishers had sales declines from 2016.”
Notable in the Top 12 is the number of European countries present, as well as companies like Thomson Reuters and News Corp who are perhaps best known for their other business activities.
10. Digital magazine app, Readly, raises $12M for further expansion
With a turnover of $80 billion, the global magazine industry is five times greater than the music industry, a press release from Readly said last month.
Yet “digital magazines represent about 6.5% of the total magazine industry turnover, a share expected to increase over the coming years.” It’s this potential which has no doubt driven further investment in the Stockholm based digital newsstand.
The company currently operates in 46 markets offering access to over 3,200 national and international digital magazines. Readly aims to use this funding for further expansion.
Their app allows users unlimited, “all-you-can-read” access to a wide range of publications – which can be viewed offline and online. It costs £7.99 a month in the UK, $9.99 in the US and €9.99 a month in the Eurozone.
However, with stiff competition expected from the Apple-owned Texture, plans for a premium version of Apple-News, as well as other players in this market, successful expansion cannot be ‘Read-ily’ guaranteed.
Seen a stat or research paper worth sharing? Tweet us @wnip